One of my long-term projects has been developing a mathematical model for scheduling in Jarrett Walker-type transit systems. Today, I made a breakthrough--
I had previously realized that a model of such a system would yield two intersecting planes in my defined 3-space, and that desired overall frequencies could be model by stacking instances of these planes atop each other. But I'd been at a loss as to how to model the routes within the planes (other than the fact that they were vectors).
What I realized today, however, is that the planes are actually a set of null space vectors; this means that a prescribed eigenvalue in the null space will seed an eigenvector that corresponds to that value. What that means is that the entire system can be modeled with nothing more than the equations of the two intersecting planes, and the set of eigenvalues that yield the eigenvectors corresponding to the known bus routes.
Fortunately, we remain in vector space so far, but it appears the apparatus I'm constructing will wind up generalizing into a differential equation, to accommodate "gridlike" systems which attempt to install a mass transit grid even over non-grid street networks.

Crossing the Lines: Site, Urban, Environmental, and Transportation Planning
Showing posts with label maths. Show all posts
Showing posts with label maths. Show all posts
Wednesday, March 19, 2014


Thursday, March 13, 2014
A Sample Program
Some notes on what a sample elhi math program would look like...
Grades 1-3: Introducing Relations
Grade 8: Algebra. The Compendious Book. al-Khwarizmi.
Grade 9: Analytic Geometry. La géométrie, Descartes.
Grade 10a: Trigonometry.
Grade 10b: Calculus.
Grade 11: Discrete Math.
Grade 12: Elective (if so chosen)
*Note order. The relations are more important than the numbers. For example, a first-grade project could be to make a family tree (create a statement of relations), and then a way to link any two members of the tree together without long text block or, well, the tree (that is, create operations). We then introduce the standard operators (perhaps in the context of the family tree project). Numbers also have to be introduced early, but teaching relations and operations needs to be separate than numbers for a while because (1) we want students to have a major aha! moment when we merge the two together, and (2) by teaching the relational/operational aspects separately from numbers, we can focus students' attention on the fact that mathematics is really relational in nature.
Grades 1-3: Introducing Relations
- What are relations?
- What are operators?
- What are numbers?*
- Numbers in real life
- Telling Time, Counting Money
- Relations Between Numbers
- Operators Symbolize Relations
- Simple Arithmetical Operations
- Add and Subtract any Pair of Numbers
- Simple Multiplication and Division (to 10)
- Geometry and Ratios
- Plato's Meno
- Archimedes and the Method of Exhaustion
- Multiplying and Dividing Larger Numbers
- Multiplying and Dividing Fractions
- Decimals, Zeros, Negative Numbers
- How to Use an Abacus
- Pythagorean Theorem
- etc.
Grade 8: Algebra. The Compendious Book. al-Khwarizmi.
Grade 9: Analytic Geometry. La géométrie, Descartes.
Grade 10a: Trigonometry.
Grade 10b: Calculus.
Grade 11: Discrete Math.
Grade 12: Elective (if so chosen)
- Combinatorics
- Boolean algebras (logic, set theory, etc.)
- Linear algebra
- Multivariable calculus
- Graph theory
- etc.
*Note order. The relations are more important than the numbers. For example, a first-grade project could be to make a family tree (create a statement of relations), and then a way to link any two members of the tree together without long text block or, well, the tree (that is, create operations). We then introduce the standard operators (perhaps in the context of the family tree project). Numbers also have to be introduced early, but teaching relations and operations needs to be separate than numbers for a while because (1) we want students to have a major aha! moment when we merge the two together, and (2) by teaching the relational/operational aspects separately from numbers, we can focus students' attention on the fact that mathematics is really relational in nature.
Wednesday, March 12, 2014
Pedagogy
I am very much of the opinion that the way we teach math here is fundamentally broken. Here are a few places where I think it can be fixed:
1. Use Greek geometry to help teach children how to experiment in math. Consider texts like Plato's Meno as an inspiration. Projects at the elementary school level could replicate Socrates' solution for finding a square with half the area as the original square (and its--easier--natural extension, a square with double the area). Projects can grow more complex* until e.g. a fifth or sixth grader can prove the Pythagorean Theorem. Using Greek math also helps introduce a deeper understanding of ratios (fractions), something teachers have confided in me American students have gotten progressively worse at.
2. Emphasize the relation, not the input and output. This is for arithmetic. Right now our arithmetic is rote, tabular, a strict interpretation of inputs into outputs. But the core of mathematical analysis is relational. Operators are nothing more than a statement of relation: We need to find a way to teach as such, instead of getting bogged down in numbers to an inordinate degree.
3. Reclaim the ancients' works. Of particular note, there is no reason whatsoever why Euclid's Elements, the standard textbook on geometry for more than two millennia, is not used in high school classrooms today. Likewise, analytic geometry should be based on Descartes' La géométrie (with van Schooten commentary and an augment of Fermat etc. papers and more illustrations); algebra, al-Khwarizmi's Compendious Book. Euler's textbooks can also be considered, but his treatment of trigonometry with complex numbers is perhaps a bit too Baroque for a modern audience. The flow algebra -> analytic geometry -> calculus also needs to be emphasized, as it is actually quite a bit more natural than most people realize. There is a case to be made that the middle school curriculum can run Euclid -> al-Khwarizmi -> Descartes, with standard calculus instruction occurring no later than the sophomore year of high school (and is a freshman subject for most students).
4. Rebuild the calculus pedagogy. One of the reason why calculus is perceived to be "hard" is because it begins with limits, but limits are discussed with insufficient tools for their analysis; by the time differentiation and integration are gotten around to, too many minds have been closed to those operations' ease and intuitive arising. Instead the pedagogy should begin with the easier operations, and once a good handle has been gotten on differentiation and integration proceed to the discussion of limits, why they matter, and how calculus operators both depend on limits and make calculating limits bearable. In addition, calculus needs to be used to cement the relational nature of math, as the elementary system is just an augment of unary function operators on analytic geometry (the only unary operation most students are exposed to prior is arithmetical negation--the difference between 2 and -2). Making use of Newton's, Leibniz's, the Bernoulli's' etc. papers is also useful, although at this point the textbooks begin to massively improve in quality.
5. Make discrete mandatory, and prerequisite to linear algebra. There are several reasons for this: (1) discrete math effectively functions as Intro to Higher Math; (2) a lot of linear algebra is essentially set theory and function theory in vector spaces; (3) with programming-language knowledge now needed even in the fine arts (according to UArts students) understanding its underpinnings is more important than ever; and (4) being able to perform in other types of discrete math, like combinatorics, is becoming increasingly necessary in our modern-day world. Understanding iterated operations and floor and ceiling functions, for example, should be SAT-level expectations.
6. Embrace models. Current mathematical pedagogy ill prepares us to actually put math to real-world use--the construction of models. This is universally covered in the various applied disciplines, but being able to construct simple models such as speed v. time (yielding velocity, acceleration, and jerk) or simple binary-string-based programs should be a skill shared by all high-school graduates. Grasping the principles needed in such modeling allows students to develop significantly more complex models to fit and extrapolate available data.
7. Embrace tradition. My final major critique is that most (not all) math teachers I've had have had little interest in exploring the tradition of math. While there are always students that complain about classroom trivia, it does a serve an important pedagogical purpose: It links learners to the discipline's tradition, helps open avenues for exploration, is often entertaining and a break from the hard work of the day, and generally makes the discipline more human, and therefore more interesting. This is true throughout most disciplines--it is hard to imagine a physics class, for example, without mention of Galileo or Newton or Einstein, or a philosophy class without Descartes, Spinoza, Leibniz, or Nietzsche; why, then, does the mathematical pedagogy persist on undervaluing its human component?
My experience with math is that when I graduated high school, I had a deep, fundamental, abiding hatred of it; it took nearly a decade to learn what I needed to to overcome this hatred. Mathematics is not valued in our society (but nor is literature); the problems turn on deep-seated pedagogical issues that tend to idealize math as a sterile, mechanical thing, instead of embracing its true nature as a very human endeavor, and a very human logical construct. To teach math right--teachers must humanize it, no matter how great the temptation otherwise.
____________
*For example, utilizing Archimedes' method of exhaustion to find a range for π (for fifth graders, for example).
1. Use Greek geometry to help teach children how to experiment in math. Consider texts like Plato's Meno as an inspiration. Projects at the elementary school level could replicate Socrates' solution for finding a square with half the area as the original square (and its--easier--natural extension, a square with double the area). Projects can grow more complex* until e.g. a fifth or sixth grader can prove the Pythagorean Theorem. Using Greek math also helps introduce a deeper understanding of ratios (fractions), something teachers have confided in me American students have gotten progressively worse at.
2. Emphasize the relation, not the input and output. This is for arithmetic. Right now our arithmetic is rote, tabular, a strict interpretation of inputs into outputs. But the core of mathematical analysis is relational. Operators are nothing more than a statement of relation: We need to find a way to teach as such, instead of getting bogged down in numbers to an inordinate degree.
3. Reclaim the ancients' works. Of particular note, there is no reason whatsoever why Euclid's Elements, the standard textbook on geometry for more than two millennia, is not used in high school classrooms today. Likewise, analytic geometry should be based on Descartes' La géométrie (with van Schooten commentary and an augment of Fermat etc. papers and more illustrations); algebra, al-Khwarizmi's Compendious Book. Euler's textbooks can also be considered, but his treatment of trigonometry with complex numbers is perhaps a bit too Baroque for a modern audience. The flow algebra -> analytic geometry -> calculus also needs to be emphasized, as it is actually quite a bit more natural than most people realize. There is a case to be made that the middle school curriculum can run Euclid -> al-Khwarizmi -> Descartes, with standard calculus instruction occurring no later than the sophomore year of high school (and is a freshman subject for most students).
4. Rebuild the calculus pedagogy. One of the reason why calculus is perceived to be "hard" is because it begins with limits, but limits are discussed with insufficient tools for their analysis; by the time differentiation and integration are gotten around to, too many minds have been closed to those operations' ease and intuitive arising. Instead the pedagogy should begin with the easier operations, and once a good handle has been gotten on differentiation and integration proceed to the discussion of limits, why they matter, and how calculus operators both depend on limits and make calculating limits bearable. In addition, calculus needs to be used to cement the relational nature of math, as the elementary system is just an augment of unary function operators on analytic geometry (the only unary operation most students are exposed to prior is arithmetical negation--the difference between 2 and -2). Making use of Newton's, Leibniz's, the Bernoulli's' etc. papers is also useful, although at this point the textbooks begin to massively improve in quality.
5. Make discrete mandatory, and prerequisite to linear algebra. There are several reasons for this: (1) discrete math effectively functions as Intro to Higher Math; (2) a lot of linear algebra is essentially set theory and function theory in vector spaces; (3) with programming-language knowledge now needed even in the fine arts (according to UArts students) understanding its underpinnings is more important than ever; and (4) being able to perform in other types of discrete math, like combinatorics, is becoming increasingly necessary in our modern-day world. Understanding iterated operations and floor and ceiling functions, for example, should be SAT-level expectations.
6. Embrace models. Current mathematical pedagogy ill prepares us to actually put math to real-world use--the construction of models. This is universally covered in the various applied disciplines, but being able to construct simple models such as speed v. time (yielding velocity, acceleration, and jerk) or simple binary-string-based programs should be a skill shared by all high-school graduates. Grasping the principles needed in such modeling allows students to develop significantly more complex models to fit and extrapolate available data.
7. Embrace tradition. My final major critique is that most (not all) math teachers I've had have had little interest in exploring the tradition of math. While there are always students that complain about classroom trivia, it does a serve an important pedagogical purpose: It links learners to the discipline's tradition, helps open avenues for exploration, is often entertaining and a break from the hard work of the day, and generally makes the discipline more human, and therefore more interesting. This is true throughout most disciplines--it is hard to imagine a physics class, for example, without mention of Galileo or Newton or Einstein, or a philosophy class without Descartes, Spinoza, Leibniz, or Nietzsche; why, then, does the mathematical pedagogy persist on undervaluing its human component?
My experience with math is that when I graduated high school, I had a deep, fundamental, abiding hatred of it; it took nearly a decade to learn what I needed to to overcome this hatred. Mathematics is not valued in our society (but nor is literature); the problems turn on deep-seated pedagogical issues that tend to idealize math as a sterile, mechanical thing, instead of embracing its true nature as a very human endeavor, and a very human logical construct. To teach math right--teachers must humanize it, no matter how great the temptation otherwise.
____________
*For example, utilizing Archimedes' method of exhaustion to find a range for π (for fifth graders, for example).
Friday, March 7, 2014
Floor and Ceiling
I just found about floor and ceiling functions the other day.
Briefly, a floor function,
 is a function that returns the greatest integer value of a real without exceeding it, and a ceiling function,
 is a function that returns the least integer value of a real once its value is exceeded.
Hence the floor of π is 3, and its ceiling is 4.
These types of functions are very useful when you've got a model whose natural output is in the real of e.g. the rationals, but whose output you need to be in the realm of the integers for the next step...This tends to happen in models built on combinatoric ideas (even if you didn't know they were combinatoric when you built them).
Briefly, a floor function,


Hence the floor of π is 3, and its ceiling is 4.
These types of functions are very useful when you've got a model whose natural output is in the real of e.g. the rationals, but whose output you need to be in the realm of the integers for the next step...This tends to happen in models built on combinatoric ideas (even if you didn't know they were combinatoric when you built them).
Friday, February 28, 2014
My Train Of Thought Is Going Over Wind Gap, Apparently
Saw this item on Systemic Failure the other day: http://systemicfailure.wordpress.com/2014/02/24/vre-replaces-apartments-with-parking/
But there is another issue buried between the lines here. 610 apartment units on a 25 acre site comes out to 24.4 units/acre. Let us simplify this to 24 u/acr, and consider that postwar "garden" apartment "barracks" are really just attached rows of duplexes or triplexes in "green" settings*. At 24 u/acr, you get (a) 12 dp/acr, or 1 duplex = 1/12 acr, and (b) 8 tp/acr, or 1 triplex = 1/8 acr. Triplexes cover less space, yielding more green space, so this complex would probably be triplexes.
Let us, by contrast, begin with the typical 25'x50' lot found in prewar suburbia, remembering of course the dictum that there is no difference between New Urbanism and prewar suburbanism. Since an acre is slightly greater than 200'x200', this implies that there are 32 lots/acre; triplexing this yields 96 u/acr, or twelve times the density of what is currently being achieved. But this is excessively dense; most railroad suburbs have emergent 50/50 homeownership/rental ratios.
Let us reserve, in line with typical consumption, 20% of our site (5 acres) for infrastructure--streets, a park, and the like. This yields 640 lots on a 25-acre site. Splitting these lots evenly, we have 320 houses and 320 plexes. Splitting the plexes evenly yields 160 duplexes and another 160 triplexes**. Summing these yields 1920 units, a whopping 315% more than the current proposal calls for. And furthermore, neighborhoods built out to this density are often just as green, and charming, as those with more green space. This implies that, past a certain amount, provision of green space is subject to diminishing returns: Just before you hit it, you get charming "green" town environments; past it, house farms.
So provision of green space is clearly not a good in and of itself. Like most anything else, it's how it's used that determines its true value. Green scraps left to fulfill zoning requirements have marginal development value and zero usage value. But modernist planning, in its flawed assertion that green space is an unmitigated good, makes no account of this. This is why house farms and towers-in-parks both tend to have the same overengineered, lawn-softened, bleakly industrial look: They are both people batteries. And because urban dynamics requires a critical mass to spark, while the lawns hide their interiors' aesthetic bleakness, they also push everything too damn far apart to spark emergent urban dynamics.
Anyway. Since the average household size today is 2.6, our 25-acre railroad suburb would yield a population of ~5000, a much fatter prize than the ~1600 the garden apartments would house, and certainly a far fatter prize than a 1500 space lot. Three other similar developments nearby would yield a nice town of 20k on 100 acres...
Modeling, the fact that, past a certain critical point, green space appears to cease to boost urbanism, and indeed, instead diminishes it needs to be considered mathematically. This critical point appears to be tied to an urbanism "critical mass". Since critical masses imply step functions, we can infer Heaviside (either it is or isn't), and can also infer that that function's discontinuity occurs at a certain percentage of green space provision. Since green space provision, by percentage, is (obviously) along the origin from (0,0) to (100,100), all we need to find is at what value green space provision, by lot, definitively hurts the formation of urban dynamics. This implies a Heaviside step from 1 (urbanism is emergent) to 0 (it is not).
Urbanism also has a clear financial buff. We need to find the nature of this buff (is it scalar? vector? etc.) and model it; knowing this information can help develop key Strong Towns tools that are not just descriptive, but predictive as well.
___________
*By stacking, not by firewalls. By firewalls, you can get du-, tri-, quad-, and hex- (6) plexes. Quadplexes by stacking (octoplexes, or 8 units, per firewall) are rare, but not unheard of; pentaplexes (5 units) by stacking and their decaplex (10 units) cousins by firewall are absent--most likely because elevator regulations start kicking in at that point.
**There are a couple of reasons for doing this. First off, different space requirements. Duplexes have more living area than triplexes in a unit shell. Secondly, this yields a Main Street of duplexes atop commercial units. But it is unreasonable to think the Main Street would consume all of the allotted duplexes.
Progress on acquiring land in the Crossroads Business Park for the 1,500-space parking lot at the planned station is moving along more slowly. Officials had originally expected the station to be open by now, but numerous issues have popped up, with the most recent problems caused by stalled negotiations for land for the commuter parking lot.Ya think? And what's worse, there are plenty of excellent examples where it's Done Right nearby--in Arlington County, in fact.
The county had been negotiating with businessmen George Lester and Fitz Johnson, who own the property needed for VRE parking. The businessmen recently gained county approval to build 610 apartment units and commercial space next to the station site.
But the negotiations for the roughly 25 acres for the parking lot have proven fruitless. So the county recently asked the Virginia Department of Transportation to handle the property acquisition.
“They can facilitate it better,” said Spotsylvania County Administrator Doug Barnes.
But there is another issue buried between the lines here. 610 apartment units on a 25 acre site comes out to 24.4 units/acre. Let us simplify this to 24 u/acr, and consider that postwar "garden" apartment "barracks" are really just attached rows of duplexes or triplexes in "green" settings*. At 24 u/acr, you get (a) 12 dp/acr, or 1 duplex = 1/12 acr, and (b) 8 tp/acr, or 1 triplex = 1/8 acr. Triplexes cover less space, yielding more green space, so this complex would probably be triplexes.
Let us, by contrast, begin with the typical 25'x50' lot found in prewar suburbia, remembering of course the dictum that there is no difference between New Urbanism and prewar suburbanism. Since an acre is slightly greater than 200'x200', this implies that there are 32 lots/acre; triplexing this yields 96 u/acr, or twelve times the density of what is currently being achieved. But this is excessively dense; most railroad suburbs have emergent 50/50 homeownership/rental ratios.
Let us reserve, in line with typical consumption, 20% of our site (5 acres) for infrastructure--streets, a park, and the like. This yields 640 lots on a 25-acre site. Splitting these lots evenly, we have 320 houses and 320 plexes. Splitting the plexes evenly yields 160 duplexes and another 160 triplexes**. Summing these yields 1920 units, a whopping 315% more than the current proposal calls for. And furthermore, neighborhoods built out to this density are often just as green, and charming, as those with more green space. This implies that, past a certain amount, provision of green space is subject to diminishing returns: Just before you hit it, you get charming "green" town environments; past it, house farms.
So provision of green space is clearly not a good in and of itself. Like most anything else, it's how it's used that determines its true value. Green scraps left to fulfill zoning requirements have marginal development value and zero usage value. But modernist planning, in its flawed assertion that green space is an unmitigated good, makes no account of this. This is why house farms and towers-in-parks both tend to have the same overengineered, lawn-softened, bleakly industrial look: They are both people batteries. And because urban dynamics requires a critical mass to spark, while the lawns hide their interiors' aesthetic bleakness, they also push everything too damn far apart to spark emergent urban dynamics.
Anyway. Since the average household size today is 2.6, our 25-acre railroad suburb would yield a population of ~5000, a much fatter prize than the ~1600 the garden apartments would house, and certainly a far fatter prize than a 1500 space lot. Three other similar developments nearby would yield a nice town of 20k on 100 acres...
Modeling, the fact that, past a certain critical point, green space appears to cease to boost urbanism, and indeed, instead diminishes it needs to be considered mathematically. This critical point appears to be tied to an urbanism "critical mass". Since critical masses imply step functions, we can infer Heaviside (either it is or isn't), and can also infer that that function's discontinuity occurs at a certain percentage of green space provision. Since green space provision, by percentage, is (obviously) along the origin from (0,0) to (100,100), all we need to find is at what value green space provision, by lot, definitively hurts the formation of urban dynamics. This implies a Heaviside step from 1 (urbanism is emergent) to 0 (it is not).
Urbanism also has a clear financial buff. We need to find the nature of this buff (is it scalar? vector? etc.) and model it; knowing this information can help develop key Strong Towns tools that are not just descriptive, but predictive as well.
___________
*By stacking, not by firewalls. By firewalls, you can get du-, tri-, quad-, and hex- (6) plexes. Quadplexes by stacking (octoplexes, or 8 units, per firewall) are rare, but not unheard of; pentaplexes (5 units) by stacking and their decaplex (10 units) cousins by firewall are absent--most likely because elevator regulations start kicking in at that point.
**There are a couple of reasons for doing this. First off, different space requirements. Duplexes have more living area than triplexes in a unit shell. Secondly, this yields a Main Street of duplexes atop commercial units. But it is unreasonable to think the Main Street would consume all of the allotted duplexes.
Tuesday, February 18, 2014
Koan of the Day
The output quality of a given social science is inversely proportional to its perceived hardness.
Friday, February 14, 2014
A Small Estimator for Neighborhood Parking
I've been working for some time on a high-grade parking estimator, and I'd like to share a simpler (albeit less accurate) variant. This estimator will give you, with a quick parameter valuation, a result to a single order of magnitude of accuracy; however, it is quick and useful to have on hand at, say, neighborhood debates.
It is written
 where f stands for the count of faces on a unit block, b stands for the count of blocks in the area under estimation, l is the mean blocklength, τ (tau or "taff") is the length of a typical onstreet space, and þ ("thorn") is the ratio of space used.
Assuming FPS, I usually set τ to 15 feet (this I call my "template" parameter) and þ to 0.75 (the "G-Ho" parameter). b is geographically determined, and f by the overarching pattern of block development. Due to our use of grids, it is most often 4. This just leaves l, which is strongly locally determined. For example, in rectangular grids (like Manhattan's), it is the average length of a block from building line to building line; in more regular neighborhoods, a typical side should suffice.
Underestimation
Since this estimator is a highly simplified version of my estimator model, it follows it has a few inherent weaknesses. The largest is a tendency to underestimate, since it fails to count interstitial streets. Most attempts to rectify this without recourse to the full estimator would require significant transformations, subdivision, and general increasing unwieldiness. Because of this, the user must--especially in a neighborhood populated by a high count of interstitial streets--assume that the model has underestimated by an order of magnitude. Yet the results attained from this estimator are significantly higher what most people realize.
Overestimation
The need for τ is obvious, but (unlike the larger estimator) there is no way for this small estimator to autocorrect for deficiencies in its setting. Since the template setting of 15 (feet) is "tight", yielding the smallest standard parallel-parking space, this can also create overestimation, especially in the first part; changing the value of τ also has ripple effects that create larger and larger deviations from the larger estimator--particularly since þ, the G-Ho parameter, is a plug-in of a result attained from the larger estimator with a τ of 15.
In my judgment, however, the underestimation effect is an order of magnitude greater than the overestimation.
To a Higher Grade
While this "small" estimator is a derivation of a much higher-grade one, I must stipulate that use of the latter requires plugging in significantly more data, and therefore comes with a contract requirement. If you or your organization wants to have your parking supply estimated, feel free to contact me; this small estimator can get you into the ballpark, but I can bring you into the infield.
It is written
Assuming FPS, I usually set τ to 15 feet (this I call my "template" parameter) and þ to 0.75 (the "G-Ho" parameter). b is geographically determined, and f by the overarching pattern of block development. Due to our use of grids, it is most often 4. This just leaves l, which is strongly locally determined. For example, in rectangular grids (like Manhattan's), it is the average length of a block from building line to building line; in more regular neighborhoods, a typical side should suffice.
Underestimation
Since this estimator is a highly simplified version of my estimator model, it follows it has a few inherent weaknesses. The largest is a tendency to underestimate, since it fails to count interstitial streets. Most attempts to rectify this without recourse to the full estimator would require significant transformations, subdivision, and general increasing unwieldiness. Because of this, the user must--especially in a neighborhood populated by a high count of interstitial streets--assume that the model has underestimated by an order of magnitude. Yet the results attained from this estimator are significantly higher what most people realize.
Overestimation
The need for τ is obvious, but (unlike the larger estimator) there is no way for this small estimator to autocorrect for deficiencies in its setting. Since the template setting of 15 (feet) is "tight", yielding the smallest standard parallel-parking space, this can also create overestimation, especially in the first part; changing the value of τ also has ripple effects that create larger and larger deviations from the larger estimator--particularly since þ, the G-Ho parameter, is a plug-in of a result attained from the larger estimator with a τ of 15.
In my judgment, however, the underestimation effect is an order of magnitude greater than the overestimation.
To a Higher Grade
While this "small" estimator is a derivation of a much higher-grade one, I must stipulate that use of the latter requires plugging in significantly more data, and therefore comes with a contract requirement. If you or your organization wants to have your parking supply estimated, feel free to contact me; this small estimator can get you into the ballpark, but I can bring you into the infield.
Sunday, November 24, 2013
Energy Thoughts
Two thoughts:
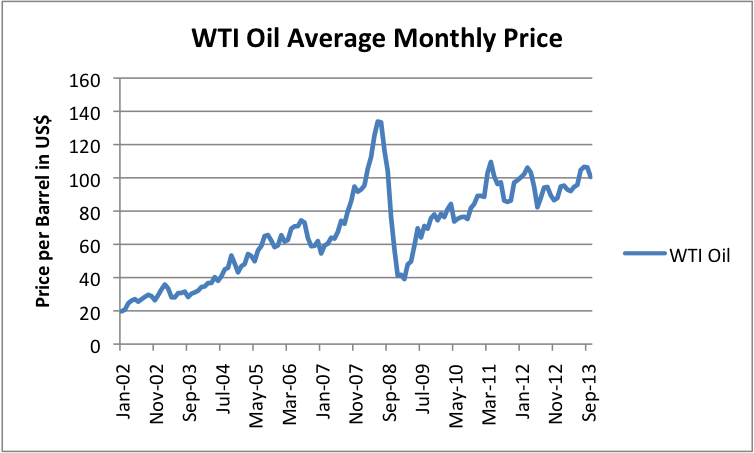
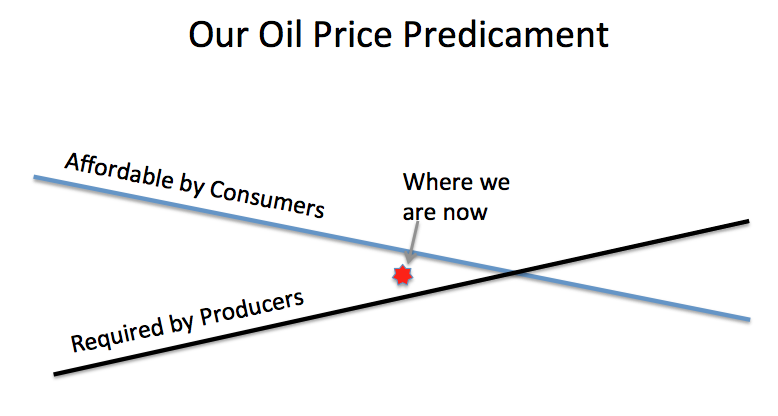
1. I would like to call attention to two images in this post.

 While the author does not flat-out say it,
if you take a look at the oil price trajectory since roughly the
beginning of 2011, you will notice that it is periodic, and that it
appears to be defined by upper and lower bounds. In mathematics, these
would be called the superior and inferior limits (limsup and liminf, respectively). These limits are converging, and models defined by these qualities yield functions such as
While the author does not flat-out say it,
if you take a look at the oil price trajectory since roughly the
beginning of 2011, you will notice that it is periodic, and that it
appears to be defined by upper and lower bounds. In mathematics, these
would be called the superior and inferior limits (limsup and liminf, respectively). These limits are converging, and models defined by these qualities yield functions such as
(This model is based on the damped periodic motion model, but with the hyperbolic limit converted to a parabolic one. A result of this is that the limsup and liminf are not linear the way they are in Gale the Actuary's visual model, but rather quadratic, with shared minima at the origins. Such a model is not as exact as I would like, but I have not yet been successful at specifying a periodic function with linear limits whose slope is nonzero. Of course, other possible permutations exist; for example, what we are treating as the origin may be more like a wave node.)*
In the math, there is a symmetry about the origin. But in reality, the problem is that the secondary feedbacks break this symmetry; the model after the origin would be dramatically different than prior to it. It does not matter what the space between the "Affordable by Consumers" function and "Required by Producers" one is, as long as what is "Required By Producers" is in overshoot of what's "Affordable by Consumers". In reality--and this is likely what Gail the Actuary's article is getting at--once the crossover is passed, producers will be forced to sell product at a price in line with the liminf; the instability of this model would, at first, be hidden via leveraging, consolidation, and conglomeration, but would ultimately exert itself through a breaking point--most likely systemic insolvency.
2. One of the commentators on the late site The Oil Drum held a certain optimist viewpoint. Energy was more expensive in the past, during the coal era, while society and the economy were vibrant; why, then, he argued, should more expensive energy cause economic contraction?
The problem is that he was right and wrong at the same time. I would like to propose a hypothesis: that the story of the Industrial Revolution was a reduction in the overall net cost of energy. However, this cost bottomed out in the era 1945-1970, the era of cheap American oil; the oil embargo and its aftereffects allowed us to leverage this cost into the future, but what I propose is that a model of the real cost of energy would show that that it has behaved like a Gaussian function--an inverted bell curve, in fact--and that we are now far enough beyond the point of local minimum to see this and not mistake it for a logistic curve or decaying exponential function. Something like
where d is the "normal" cost of energy the curve is asymptotic to, e is the transcendental number, and a, b, and c are other parameters.
For the argument I wish to make, however, we can approximate the curved element of the function as a simple quadratic, say
The reason we'll do this is because the problem with this commentator's argument is that it ignores the change in the cost of energy over time: that is, it treats this cost as a static element. If one derives this function, dy/dx=x/2-1 via the power rule, to obtain the slope of the tangent line, and utilize this to find its behavior at, say, y(0), one will quickly see that such a line is negative. That is, prior to the minimum, the net cost of energy is decreasing. And of course, after it, it is increasing.
As much of the current economic system is predicated on the assumption that said cost is always decreasing (assuming it can be modeled by y=-x^3, whose derivative, -3x^2, always yields a negative tangent line, maybe?), creation of, and access to, flows of capital would have been significantly easier even when the net cost of energy was higher if its change over time was a decrease. In a post-Peak Oil era, that net cost is always increasing--if we are lucky, we might be able to apply enough renewables to the overall mix for it to balance at a level lower than its c. 1600 cost--but, because of this fact of elementary calculus, dependent secondary systems with flawed assumptions about the nature of the primary system will be unable to adapt to the new status quo.
This does not, of course, translate into a "doomer" argument, such as the ones Mr. Kunstler is fond of. Instead, it merely states that dependent secondary systems on the cost of fuel must adapt to changes in the trajectory of the primary system, or fail. The issue at hand is, what are the necessary adaptations? Doomers are fond of pointing out the structural weaknesses that they believe end in failure; they are much less fond of considering the consequences of this change in trajectory, and the adaptations needed for the dependent systems to continue working. It's this latter line of inquiry I find much more interesting.
*NOTE: One of the effects, the asymmetry about the origin, becomes clearer if one cubes the squared exponential parameter of e, i.e. y(t)=[Ae^(-(bt/2m)^3][cos(ωt+φ)], with the core remaining the damped periodic motion model. Cubed limsup and liminf also do cross over, an issue inherent in the squared ones. This model, however, flatlines after the origin, such that it becomes effectively impossible to use it to tell anything about what happens after the crossing point.
1. I would like to call attention to two images in this post.
y(t)=[Ae^(bt/2m)^2][cos(ωt+φ)].
(This model is based on the damped periodic motion model, but with the hyperbolic limit converted to a parabolic one. A result of this is that the limsup and liminf are not linear the way they are in Gale the Actuary's visual model, but rather quadratic, with shared minima at the origins. Such a model is not as exact as I would like, but I have not yet been successful at specifying a periodic function with linear limits whose slope is nonzero. Of course, other possible permutations exist; for example, what we are treating as the origin may be more like a wave node.)*
In the math, there is a symmetry about the origin. But in reality, the problem is that the secondary feedbacks break this symmetry; the model after the origin would be dramatically different than prior to it. It does not matter what the space between the "Affordable by Consumers" function and "Required by Producers" one is, as long as what is "Required By Producers" is in overshoot of what's "Affordable by Consumers". In reality--and this is likely what Gail the Actuary's article is getting at--once the crossover is passed, producers will be forced to sell product at a price in line with the liminf; the instability of this model would, at first, be hidden via leveraging, consolidation, and conglomeration, but would ultimately exert itself through a breaking point--most likely systemic insolvency.
2. One of the commentators on the late site The Oil Drum held a certain optimist viewpoint. Energy was more expensive in the past, during the coal era, while society and the economy were vibrant; why, then, he argued, should more expensive energy cause economic contraction?
The problem is that he was right and wrong at the same time. I would like to propose a hypothesis: that the story of the Industrial Revolution was a reduction in the overall net cost of energy. However, this cost bottomed out in the era 1945-1970, the era of cheap American oil; the oil embargo and its aftereffects allowed us to leverage this cost into the future, but what I propose is that a model of the real cost of energy would show that that it has behaved like a Gaussian function--an inverted bell curve, in fact--and that we are now far enough beyond the point of local minimum to see this and not mistake it for a logistic curve or decaying exponential function. Something like
y(x)=-ae^(((x-b)/2c)^2)+d,
where d is the "normal" cost of energy the curve is asymptotic to, e is the transcendental number, and a, b, and c are other parameters.
For the argument I wish to make, however, we can approximate the curved element of the function as a simple quadratic, say
y(x)=x^2/4-x+3
The reason we'll do this is because the problem with this commentator's argument is that it ignores the change in the cost of energy over time: that is, it treats this cost as a static element. If one derives this function, dy/dx=x/2-1 via the power rule, to obtain the slope of the tangent line, and utilize this to find its behavior at, say, y(0), one will quickly see that such a line is negative. That is, prior to the minimum, the net cost of energy is decreasing. And of course, after it, it is increasing.
As much of the current economic system is predicated on the assumption that said cost is always decreasing (assuming it can be modeled by y=-x^3, whose derivative, -3x^2, always yields a negative tangent line, maybe?), creation of, and access to, flows of capital would have been significantly easier even when the net cost of energy was higher if its change over time was a decrease. In a post-Peak Oil era, that net cost is always increasing--if we are lucky, we might be able to apply enough renewables to the overall mix for it to balance at a level lower than its c. 1600 cost--but, because of this fact of elementary calculus, dependent secondary systems with flawed assumptions about the nature of the primary system will be unable to adapt to the new status quo.
This does not, of course, translate into a "doomer" argument, such as the ones Mr. Kunstler is fond of. Instead, it merely states that dependent secondary systems on the cost of fuel must adapt to changes in the trajectory of the primary system, or fail. The issue at hand is, what are the necessary adaptations? Doomers are fond of pointing out the structural weaknesses that they believe end in failure; they are much less fond of considering the consequences of this change in trajectory, and the adaptations needed for the dependent systems to continue working. It's this latter line of inquiry I find much more interesting.
*NOTE: One of the effects, the asymmetry about the origin, becomes clearer if one cubes the squared exponential parameter of e, i.e. y(t)=[Ae^(-(bt/2m)^3][cos(ωt+φ)], with the core remaining the damped periodic motion model. Cubed limsup and liminf also do cross over, an issue inherent in the squared ones. This model, however, flatlines after the origin, such that it becomes effectively impossible to use it to tell anything about what happens after the crossing point.
Wednesday, May 9, 2012
How Much, Really, Can You Squeeze In?
This post is inspired by a quote from a Mayor's Office of Transportation and Utilities (MOTU) spokesperson in an interview from Plan Philly having to do with the 10th Street Chinatown bike lane: that the technical maximum per traffic lane is 800 vehicles/hour.
Now, I'll agree that there's a technical maximum. I am not so sure that it is so blasély quantifiable. Think about it: the movement of a car has two geometrical elements that must pass any point or line before the next can take its place in safe progression--the carbody itself, as well as the reaction space in front of the car. This unoccupied reaction space grows proportionally to the speed of travel--it decreases the total number of vehicles which can safely progress through a point the faster these vehicles are going.
Another way of saying this is that per-lane traffic progression (throughput) is a function of the reaction space of the car, itself a function of the speed of the car. As mean speed goes up, throughput (how many cars can actually progress through a given point) goes down, and vice versa, until stop is achieved and the system is clogged.
Ironically enough, peak throughput occurs when the system is so congested as to inhibit unimpeded movement, but no so congested as to actually be clogged--that is to say, a rush hour traffic jam. Peak throughput occurs in speeds that utterly fail to capitalize on the car's major advantages (i.e. its speed premium) and so autocentric traffic systems are designed in such a way as to avoid peak throughput. This, in its turn, incurs further costs (transportation mode restriction, increased spatial consumption = sprawl, etc.).
Let us assume mean speed on the stretch of 10th St. in question is 10 mph. It's in Chinatown, which lots of stoplights, jaywalkers, and cars coming from the north or off the Vine Street Expwy., so this is a reasonable assumption. Given the throughput model I've just outlined here, how many cars can pass per hour in a single driving lane?
Since 1 mile = 5280 ft., 10 miles = 52,800 ft. Therefore a vehicle traveling 10 mph traverses 52,800 feet in an hour. The PA Driver's Manual recommends keeping 6 seconds' stopping distance, and a rule of thumb is that the stopping distance is roughly 1 carlength per 10 mph.
6 seconds' stopping distance is 52,800/60 = 800 feet/min, 800/60 = 13.3 ft/sec, 13.3*6 = 80 ft. stopping distance. Obviously not a tenable figure for any reasonable calculation*.
So let us use the rule of thumb then. Picture a row of cars lined up, bumper-to-bumper, exactly a mile long. Since the rule of thumb is that a car's stopping distance is itself every 10 mph, we can divide to obtain the number we're looking for.
For this purpose, let us say the average car is 18 ft. SUVs and light trucks are 20 ft. (or longer), while coupes are around 15 ft. This means there are 294 cars to the mile. Divide by half and we see that 147 cars can traverse 1 mile at 10 mph; multiply this by 10 and the number is 1,470 cars/hr (quite a bit more than 800 cars/hr)**.
Having tried these two calculations, one significantly lower than the MOTU number, and the other significantly higher--but the MOTU number floating serenely almost at the exact median between the two--we're forced to wonder: how did they come up with this number in the first place?
___________
* But if you must know, this works out to an average geometric car being 98 feet long! It would take 7.37 seconds for this body to traverse that distance at that speed, which works out to 488.47 of those things in an hour--which is significantly lower than the MOTU number^.
^ Let's take this model further. 5280 ft/mile = 316,800 ft traversed at 60 mph. 316,800/3600 = 88 feet traversed per second. 88(6) = 528 ft reaction space + 18 ft (car) = 546 ft. geometrical object. 316,800/546 = 580.22 vehicles/hr at 60 mph^^^.
** According to this model, a car traveling at 20 mph is 3 vehicle units, at 30, 4, at 40, 5, and so on^^. So you can amortize to the hour to figure out traversal per point in an hour^^^.
^^ The model can be described as x = (C/y)z, where x is maximal cars/lane/mile in unimpeded conditions, C is carlengths per mile (a unit of length), y is geometric carlengths needed for free-flowing conditions per x10 mph, and z is mph.
^^^ But this contradicts the hypothesis I described earlier in the post. Throughput at 60 mph would be (297/7)60 = 2520 cars/lane/hr, which is noticeably higher than 10 mph throughput of 1470 cars/lane/hour. What do we make of this? A solution may be that the numbers we're using all describe free-flowing (unimpeded) conditions, whereas congestion is congested (impeded) conditions.
Now, I'll agree that there's a technical maximum. I am not so sure that it is so blasély quantifiable. Think about it: the movement of a car has two geometrical elements that must pass any point or line before the next can take its place in safe progression--the carbody itself, as well as the reaction space in front of the car. This unoccupied reaction space grows proportionally to the speed of travel--it decreases the total number of vehicles which can safely progress through a point the faster these vehicles are going.
Another way of saying this is that per-lane traffic progression (throughput) is a function of the reaction space of the car, itself a function of the speed of the car. As mean speed goes up, throughput (how many cars can actually progress through a given point) goes down, and vice versa, until stop is achieved and the system is clogged.
Ironically enough, peak throughput occurs when the system is so congested as to inhibit unimpeded movement, but no so congested as to actually be clogged--that is to say, a rush hour traffic jam. Peak throughput occurs in speeds that utterly fail to capitalize on the car's major advantages (i.e. its speed premium) and so autocentric traffic systems are designed in such a way as to avoid peak throughput. This, in its turn, incurs further costs (transportation mode restriction, increased spatial consumption = sprawl, etc.).
Let us assume mean speed on the stretch of 10th St. in question is 10 mph. It's in Chinatown, which lots of stoplights, jaywalkers, and cars coming from the north or off the Vine Street Expwy., so this is a reasonable assumption. Given the throughput model I've just outlined here, how many cars can pass per hour in a single driving lane?
Since 1 mile = 5280 ft., 10 miles = 52,800 ft. Therefore a vehicle traveling 10 mph traverses 52,800 feet in an hour. The PA Driver's Manual recommends keeping 6 seconds' stopping distance, and a rule of thumb is that the stopping distance is roughly 1 carlength per 10 mph.
6 seconds' stopping distance is 52,800/60 = 800 feet/min, 800/60 = 13.3 ft/sec, 13.3*6 = 80 ft. stopping distance. Obviously not a tenable figure for any reasonable calculation*.
So let us use the rule of thumb then. Picture a row of cars lined up, bumper-to-bumper, exactly a mile long. Since the rule of thumb is that a car's stopping distance is itself every 10 mph, we can divide to obtain the number we're looking for.
For this purpose, let us say the average car is 18 ft. SUVs and light trucks are 20 ft. (or longer), while coupes are around 15 ft. This means there are 294 cars to the mile. Divide by half and we see that 147 cars can traverse 1 mile at 10 mph; multiply this by 10 and the number is 1,470 cars/hr (quite a bit more than 800 cars/hr)**.
Having tried these two calculations, one significantly lower than the MOTU number, and the other significantly higher--but the MOTU number floating serenely almost at the exact median between the two--we're forced to wonder: how did they come up with this number in the first place?
___________
* But if you must know, this works out to an average geometric car being 98 feet long! It would take 7.37 seconds for this body to traverse that distance at that speed, which works out to 488.47 of those things in an hour--which is significantly lower than the MOTU number^.
^ Let's take this model further. 5280 ft/mile = 316,800 ft traversed at 60 mph. 316,800/3600 = 88 feet traversed per second. 88(6) = 528 ft reaction space + 18 ft (car) = 546 ft. geometrical object. 316,800/546 = 580.22 vehicles/hr at 60 mph^^^.
** According to this model, a car traveling at 20 mph is 3 vehicle units, at 30, 4, at 40, 5, and so on^^. So you can amortize to the hour to figure out traversal per point in an hour^^^.
^^ The model can be described as x = (C/y)z, where x is maximal cars/lane/mile in unimpeded conditions, C is carlengths per mile (a unit of length), y is geometric carlengths needed for free-flowing conditions per x10 mph, and z is mph.
^^^ But this contradicts the hypothesis I described earlier in the post. Throughput at 60 mph would be (297/7)60 = 2520 cars/lane/hr, which is noticeably higher than 10 mph throughput of 1470 cars/lane/hour. What do we make of this? A solution may be that the numbers we're using all describe free-flowing (unimpeded) conditions, whereas congestion is congested (impeded) conditions.
Monday, June 20, 2011
Idle Thoughts
Idle Thought #1: In Alon Levy's latest post, he argues that international intercity links of all stripes underperform their domestic counterparts. Hence a Seattle-Vancouver link would underperform relative a Seattle-Portland one, even though Vancouver's closer. The argument is convincing.
However, he makes a point he doesn't really take up again, namely that "Eurostar’s mode share is quite normal by the standards of other HSR lines of comparable travel time". Since the market's undersized, the total ridership on the high-speed line will likewise be undersized...but the fact that London-Paris Eurostar commands an equivalent mode share (as measured by percentage of trips taken per mode used) in its market as, say, the Paris-Brussels Thalys does in its market, offers a key into how we want to do ridership projection modeling for intercity high-speed service--namely, we want to create a model which prioritizes mode-share rather than just an absolute count of riders. Knowing the size of the current travel market (in terms of total trips taken), the size of the mode share being aimed for, and the average ridership per trip, we can actually create an extremely simple and effective model for figuring out whether a particular market is profitable for high-speed rail relative to ridership. Secondly, since most rail lines are actually linked corridors, finding the mode share for each significant intercity pair, extrapolating ridership, and then adding it all up into a combined ridership (for example, the mode share of D.C.-N.Y. = mode share of D.C.-N.Y. + D.C.-Philly + D.C.-Baltimore + N.Y.-Philly + N.Y.-Baltimore + Philly-Baltimore) should create a powerful, effective mechanism for ascertaining projected ridership.
For example, let us assume the travel markets between Cities A, B, and C are all 10 million, and the mode shares for City A-City B and City B-City C are 70% rail, 20% air, and 10% road (relatively common for intra-megalopolis travel), while City A-City C is 50% rail, 40% air, and 10% road (think Tokyo-Hiroshima). 70% of 10 million is 7 million, and 50% 5 million. Hence total ridership on the line connecting Cities A and C via City B will be 7m + 7m + 5m = 19m, which, if I remember correctly, should be a rough estimate of the total ridership of the Tokyo-Osaka-Hiroshima shinkansen, or perhaps the TAV between Milan and Naples via Rome.
Idle Thought #2: In today's Sunday Train, Bruce McF mentions that "whenever a Republican passes over the opportunity to propose regulatory reform, it seems worthwhile to look at what regulatory reform might have to offer". This falls squarely into my overarching narrative of how modern Republicans (most lately under the guise of the Tea Party) are using populist-libertarian ideology to shroud and advance corporatist interests, and furthermore that the Tea Party ideology is in fact only made possible due to a now-generation-long collusion between corporate conservatives and televangelists, and that elements of televangelical* culture, such as those which create the whole astroturfed "controversy" between evolutionary theory andcreationism intelligent design, demonstrate clear cultural values in anti-intellectualism and dogma acceptance...or, to put it another way, their "real world" is quite different from ours.
Anyway, sidetrack aside, "whenever a Republican passes over the opportunity to propose regulatory reform," considering that true libertarianism is always anti-regulatory in nature, this offers a clue into real motives. While the libertarian argument is that regulation is always bad, due to it detracting from the ability to do business, the progressive counterargument is that regulation, when properly done, is a sort of legal referee making sure the public get what they think they're getting when they get something. After all, we'd rather not buy a burger full of shit or poisoned rat carcasses. So, when an ostensibly anti-regulation politician passes on the chance to tackle regulatory reform head-on--and on regulation that is widely considered, across the political spectrum, to be broken, at that--to score political points in a vainglorious attempt to undermine Amtrak's political coalition, we can be sure something's going on, and the public's best interests are not being properly represented. Even the Department of Transportation's own recent FRA reform was exceedingly tepid, especially for a regulatory framework so baldly, badly broken by international standards. Someone wants the current regime to stay in place--who? A special-interest coalition, I bet, of (a) the freight railroads, (b) AASHTO, and (c) unions (who see "Buy America" as ensuring work)**. The result? A promulgation of the broken status quo.
One thing we can be rest assured of, however, is that the Tea Party and our politicians are making such a mockery out of libertarian thinking it's damaging real libertarianism (of the Market Urbanism kind) and progressivism alike.
____________
* That is, the culture of Billy Graham-style evangelists.
** In direct contravention to the let-it-go-it'll-work style of libertarian thinking. Actually, bringing American rail regulation in line with UIC standards and eliminating Buy America will almost certainly create more jobs than it eliminates--because it allows the tools to start creating more passenger rail in a country where so much of it has been lost, and once enough potential buyers are in place, the domestic industry will follow. The current regulatory environment is very much putting the cart before the horse--no wonder it fails so hard!
However, he makes a point he doesn't really take up again, namely that "Eurostar’s mode share is quite normal by the standards of other HSR lines of comparable travel time". Since the market's undersized, the total ridership on the high-speed line will likewise be undersized...but the fact that London-Paris Eurostar commands an equivalent mode share (as measured by percentage of trips taken per mode used) in its market as, say, the Paris-Brussels Thalys does in its market, offers a key into how we want to do ridership projection modeling for intercity high-speed service--namely, we want to create a model which prioritizes mode-share rather than just an absolute count of riders. Knowing the size of the current travel market (in terms of total trips taken), the size of the mode share being aimed for, and the average ridership per trip, we can actually create an extremely simple and effective model for figuring out whether a particular market is profitable for high-speed rail relative to ridership. Secondly, since most rail lines are actually linked corridors, finding the mode share for each significant intercity pair, extrapolating ridership, and then adding it all up into a combined ridership (for example, the mode share of D.C.-N.Y. = mode share of D.C.-N.Y. + D.C.-Philly + D.C.-Baltimore + N.Y.-Philly + N.Y.-Baltimore + Philly-Baltimore) should create a powerful, effective mechanism for ascertaining projected ridership.
For example, let us assume the travel markets between Cities A, B, and C are all 10 million, and the mode shares for City A-City B and City B-City C are 70% rail, 20% air, and 10% road (relatively common for intra-megalopolis travel), while City A-City C is 50% rail, 40% air, and 10% road (think Tokyo-Hiroshima). 70% of 10 million is 7 million, and 50% 5 million. Hence total ridership on the line connecting Cities A and C via City B will be 7m + 7m + 5m = 19m, which, if I remember correctly, should be a rough estimate of the total ridership of the Tokyo-Osaka-Hiroshima shinkansen, or perhaps the TAV between Milan and Naples via Rome.
Idle Thought #2: In today's Sunday Train, Bruce McF mentions that "whenever a Republican passes over the opportunity to propose regulatory reform, it seems worthwhile to look at what regulatory reform might have to offer". This falls squarely into my overarching narrative of how modern Republicans (most lately under the guise of the Tea Party) are using populist-libertarian ideology to shroud and advance corporatist interests, and furthermore that the Tea Party ideology is in fact only made possible due to a now-generation-long collusion between corporate conservatives and televangelists, and that elements of televangelical* culture, such as those which create the whole astroturfed "controversy" between evolutionary theory and
Anyway, sidetrack aside, "whenever a Republican passes over the opportunity to propose regulatory reform," considering that true libertarianism is always anti-regulatory in nature, this offers a clue into real motives. While the libertarian argument is that regulation is always bad, due to it detracting from the ability to do business, the progressive counterargument is that regulation, when properly done, is a sort of legal referee making sure the public get what they think they're getting when they get something. After all, we'd rather not buy a burger full of shit or poisoned rat carcasses. So, when an ostensibly anti-regulation politician passes on the chance to tackle regulatory reform head-on--and on regulation that is widely considered, across the political spectrum, to be broken, at that--to score political points in a vainglorious attempt to undermine Amtrak's political coalition, we can be sure something's going on, and the public's best interests are not being properly represented. Even the Department of Transportation's own recent FRA reform was exceedingly tepid, especially for a regulatory framework so baldly, badly broken by international standards. Someone wants the current regime to stay in place--who? A special-interest coalition, I bet, of (a) the freight railroads, (b) AASHTO, and (c) unions (who see "Buy America" as ensuring work)**. The result? A promulgation of the broken status quo.
One thing we can be rest assured of, however, is that the Tea Party and our politicians are making such a mockery out of libertarian thinking it's damaging real libertarianism (of the Market Urbanism kind) and progressivism alike.
____________
* That is, the culture of Billy Graham-style evangelists.
** In direct contravention to the let-it-go-it'll-work style of libertarian thinking. Actually, bringing American rail regulation in line with UIC standards and eliminating Buy America will almost certainly create more jobs than it eliminates--because it allows the tools to start creating more passenger rail in a country where so much of it has been lost, and once enough potential buyers are in place, the domestic industry will follow. The current regulatory environment is very much putting the cart before the horse--no wonder it fails so hard!
Subscribe to:
Posts (Atom)