
1. I would like to call attention to two images in this post.
y(t)=[Ae^(bt/2m)^2][cos(ωt+φ)].
(This model is based on the damped periodic motion model, but with the hyperbolic limit converted to a parabolic one. A result of this is that the limsup and liminf are not linear the way they are in Gale the Actuary's visual model, but rather quadratic, with shared minima at the origins. Such a model is not as exact as I would like, but I have not yet been successful at specifying a periodic function with linear limits whose slope is nonzero. Of course, other possible permutations exist; for example, what we are treating as the origin may be more like a wave node.)*
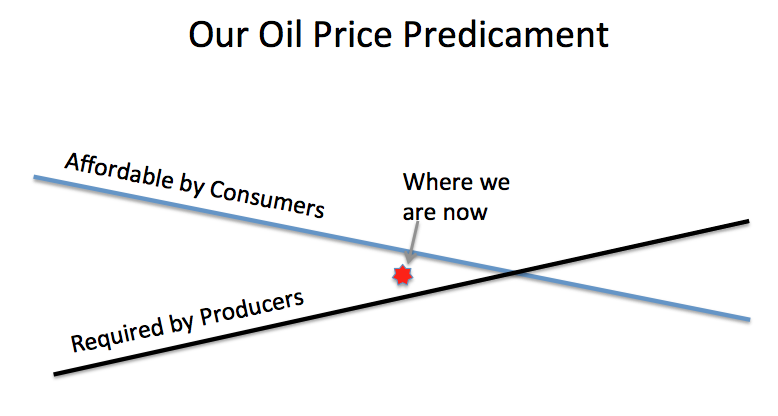
In the math, there is a symmetry about the origin. But in reality, the problem is that the secondary feedbacks break this symmetry; the model after the origin would be dramatically different than prior to it. It does not matter what the space between the "Affordable by Consumers" function and "Required by Producers" one is, as long as what is "Required By Producers" is in overshoot of what's "Affordable by Consumers". In reality--and this is likely what Gail the Actuary's article is getting at--once the crossover is passed, producers will be forced to sell product at a price in line with the liminf; the instability of this model would, at first, be hidden via leveraging, consolidation, and conglomeration, but would ultimately exert itself through a breaking point--most likely systemic insolvency.
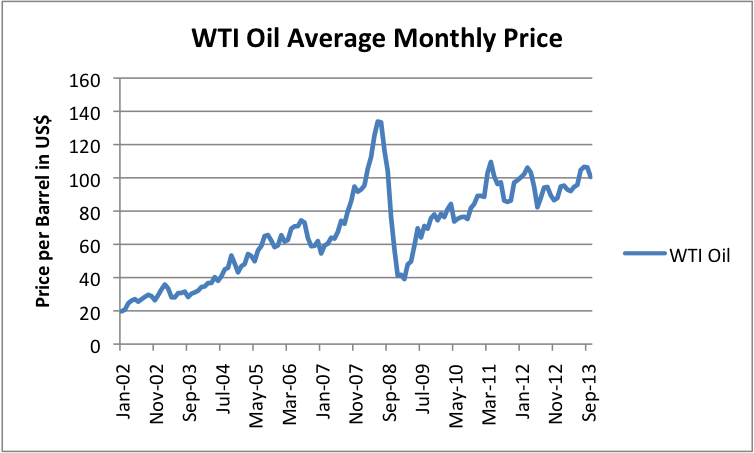
2. One of the commentators on the late site The Oil Drum held a certain optimist viewpoint. Energy was more expensive in the past, during the coal era, while society and the economy were vibrant; why, then, he argued, should more expensive energy cause economic contraction?
The problem is that he was right and wrong at the same time. I would like to propose a hypothesis: that the story of the Industrial Revolution was a reduction in the overall net cost of energy. However, this cost bottomed out in the era 1945-1970, the era of cheap American oil; the oil embargo and its aftereffects allowed us to leverage this cost into the future, but what I propose is that a model of the real cost of energy would show that that it has behaved like a Gaussian function--an inverted bell curve, in fact--and that we are now far enough beyond the point of local minimum to see this and not mistake it for a logistic curve or decaying exponential function. Something like
y(x)=-ae^(((x-b)/2c)^2)+d,
where d is the "normal" cost of energy the curve is asymptotic to, e is the transcendental number, and a, b, and c are other parameters.
For the argument I wish to make, however, we can approximate the curved element of the function as a simple quadratic, say
y(x)=x^2/4-x+3
The reason we'll do this is because the problem with this commentator's argument is that it ignores the change in the cost of energy over time: that is, it treats this cost as a static element. If one derives this function, dy/dx=x/2-1 via the power rule, to obtain the slope of the tangent line, and utilize this to find its behavior at, say, y(0), one will quickly see that such a line is negative. That is, prior to the minimum, the net cost of energy is decreasing. And of course, after it, it is increasing.
As much of the current economic system is predicated on the assumption that said cost is always decreasing (assuming it can be modeled by y=-x^3, whose derivative, -3x^2, always yields a negative tangent line, maybe?), creation of, and access to, flows of capital would have been significantly easier even when the net cost of energy was higher if its change over time was a decrease. In a post-Peak Oil era, that net cost is always increasing--if we are lucky, we might be able to apply enough renewables to the overall mix for it to balance at a level lower than its c. 1600 cost--but, because of this fact of elementary calculus, dependent secondary systems with flawed assumptions about the nature of the primary system will be unable to adapt to the new status quo.
This does not, of course, translate into a "doomer" argument, such as the ones Mr. Kunstler is fond of. Instead, it merely states that dependent secondary systems on the cost of fuel must adapt to changes in the trajectory of the primary system, or fail. The issue at hand is, what are the necessary adaptations? Doomers are fond of pointing out the structural weaknesses that they believe end in failure; they are much less fond of considering the consequences of this change in trajectory, and the adaptations needed for the dependent systems to continue working. It's this latter line of inquiry I find much more interesting.
*NOTE: One of the effects, the asymmetry about the origin, becomes clearer if one cubes the squared exponential parameter of e, i.e. y(t)=[Ae^(-(bt/2m)^3][cos(ωt+φ)], with the core remaining the damped periodic motion model. Cubed limsup and liminf also do cross over, an issue inherent in the squared ones. This model, however, flatlines after the origin, such that it becomes effectively impossible to use it to tell anything about what happens after the crossing point.